Aim
The aim of this project was to explore publicly available housing data in the UK to investigate changes in housing prices between areas over time.
Step 1 – I used some ETL techniques on the data to make it easier to work with. This involved transforming data types, converting dates into a year column and then merging the two datasets (one containing population density information, and one containing housing price data based on the “County” column and the “Year” columns so that it only included data where it is available in both datasets).
I created some quick visualisations to get an overview of any patterns in house prices and population density over the 20 year period.

There is a clear shift towards higher housing prices over the 20 year period and the flatter and wider bell curve in the 2021 data indicates increased variability in house prices.
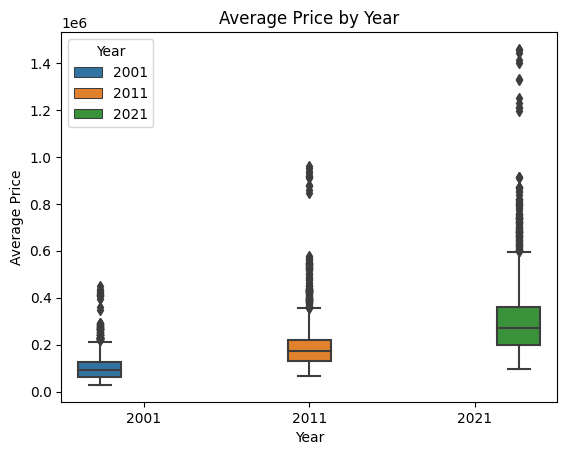
There are a significant number of outliers in these data, indicating a minority of significantly higher house prices for particular counties. You can barely see these outliers in the histogram above as tiny bars up to around 1.5m. I wanted to first check the Z score to identify the outliers:

These counties were at least 3 standard deviations above the mean and can therefore be identified as outliers.
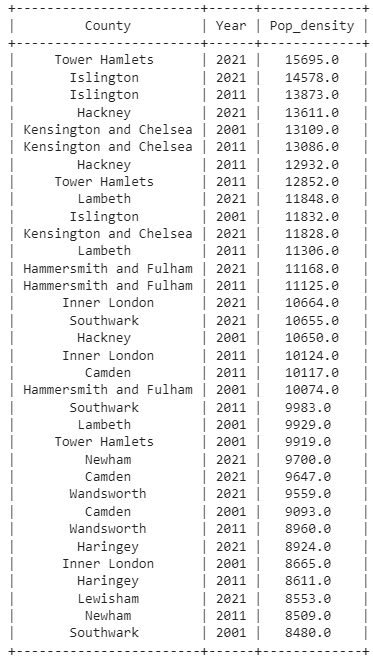
Next I wanted to take a look at population densities:


I was curious to have a quick look to see which counties have reduced in population density and/or average house price. Here are the results:

When the group size is larger, the absolute numbers of units entering or leaving the group are likely to be larger than those smaller groups who may experience a greater % of change. I was more interested in % change rather than the absolute number because this implies stronger external influence is pushing people to come or go to a particular county and it is interesting to speculate on what that might be.
Interesting that the two most expensive counties have also experienced the greatest reduction in population density in the last decade. The population size of Kensington and Chelsea has decreased by 9.6%, from around 158,600 in 2011 to 143,400 in 2021. A quick google search revealed that “Some have suggested that the borough’s declining population could be the result of its expensive housing, with property prices rising by almost 14% in the past year, according to data released by the real estate firm, Rightmove.”
I was curious about which counties had initially reduced in population density and then in the second decade increased again and why this might be. Here were the counties which matched this description:
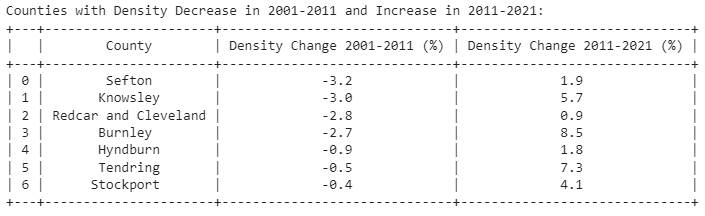
Geography was never my greatest strength, so I used Power BI to visualise these locations:
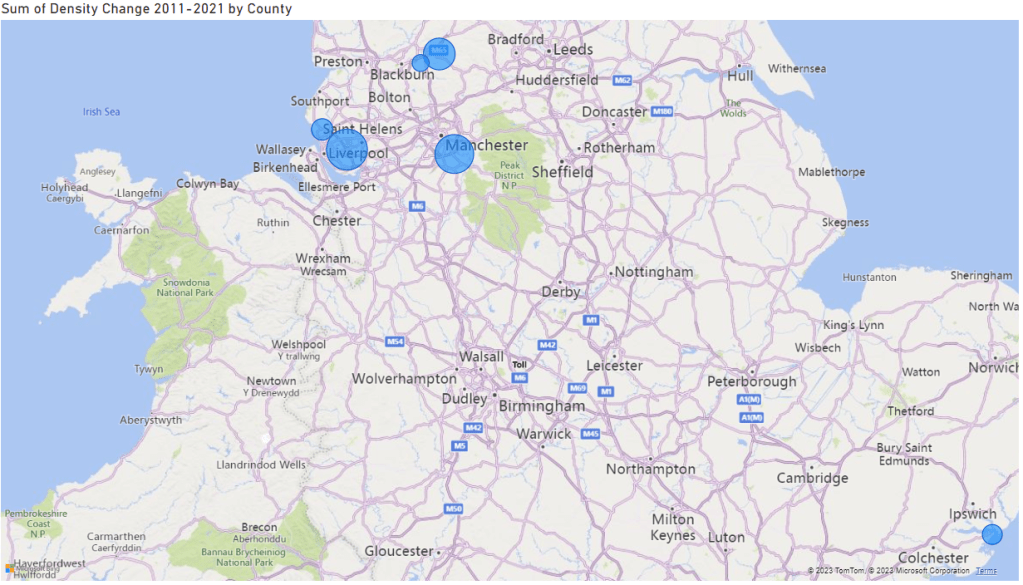
This revealed a cluster in the north west near Manchester and Liverpool. I wondered if this was something to do with the planned HS2 high speed rail. According to Wikipedia “In January 2012, the Secretary of State for Transport announced that HS2 would go ahead.” So this may have lead to an increased interest in moving to (and staying in) those areas.
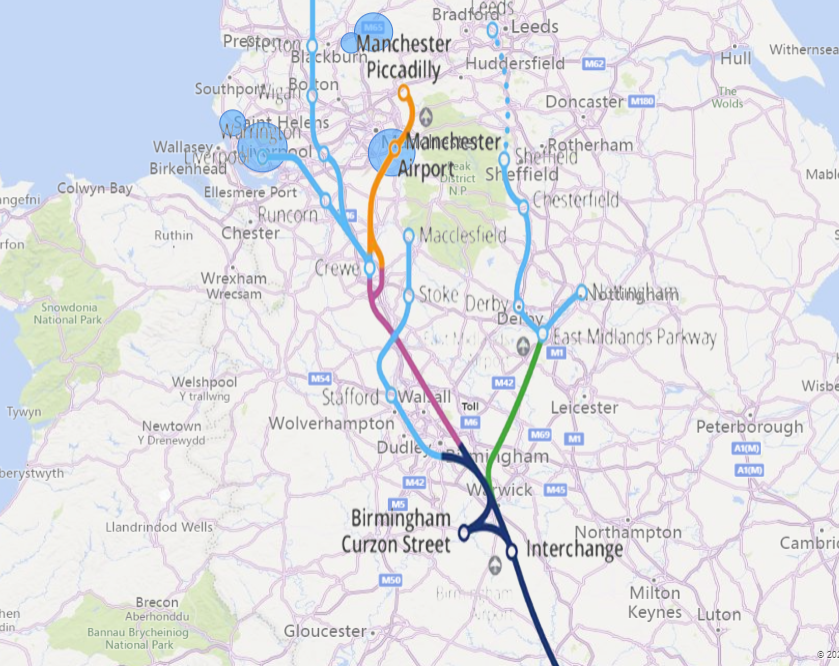
Superimposing the HS2 path onto the Power BI visualisation map suggests that this could indeed be the case. I wondered if the house prices reflected this:
They all increased in price, but not necessarily more than the average increase in price over the last decade.

This compares with the average price changes for those years:

I wanted to see if there was any general relationship between population density and housing prices.
To answer this, I ran a linear regression model to compare the average house price and population density of each county sub-grouped into the 3 years of interest to see how well these two variables predict one another. Here are the results:

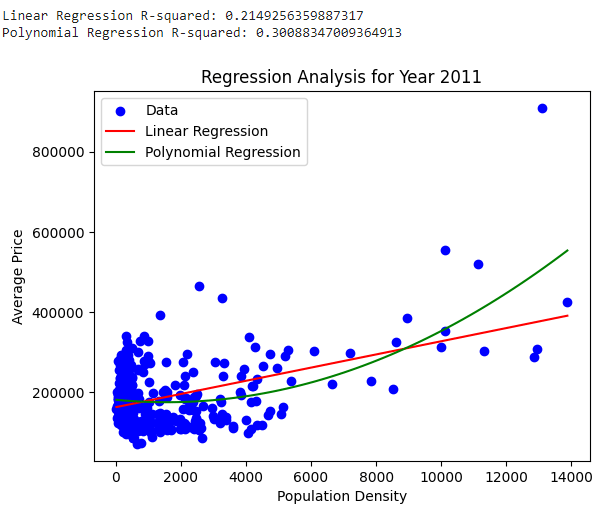

The R-Squared values for each year are quite low (0.17-0.31) indicating that although we see a positive correlation population density (both with the linear regression and polynomial) alone is a weak predictor of average house price.
